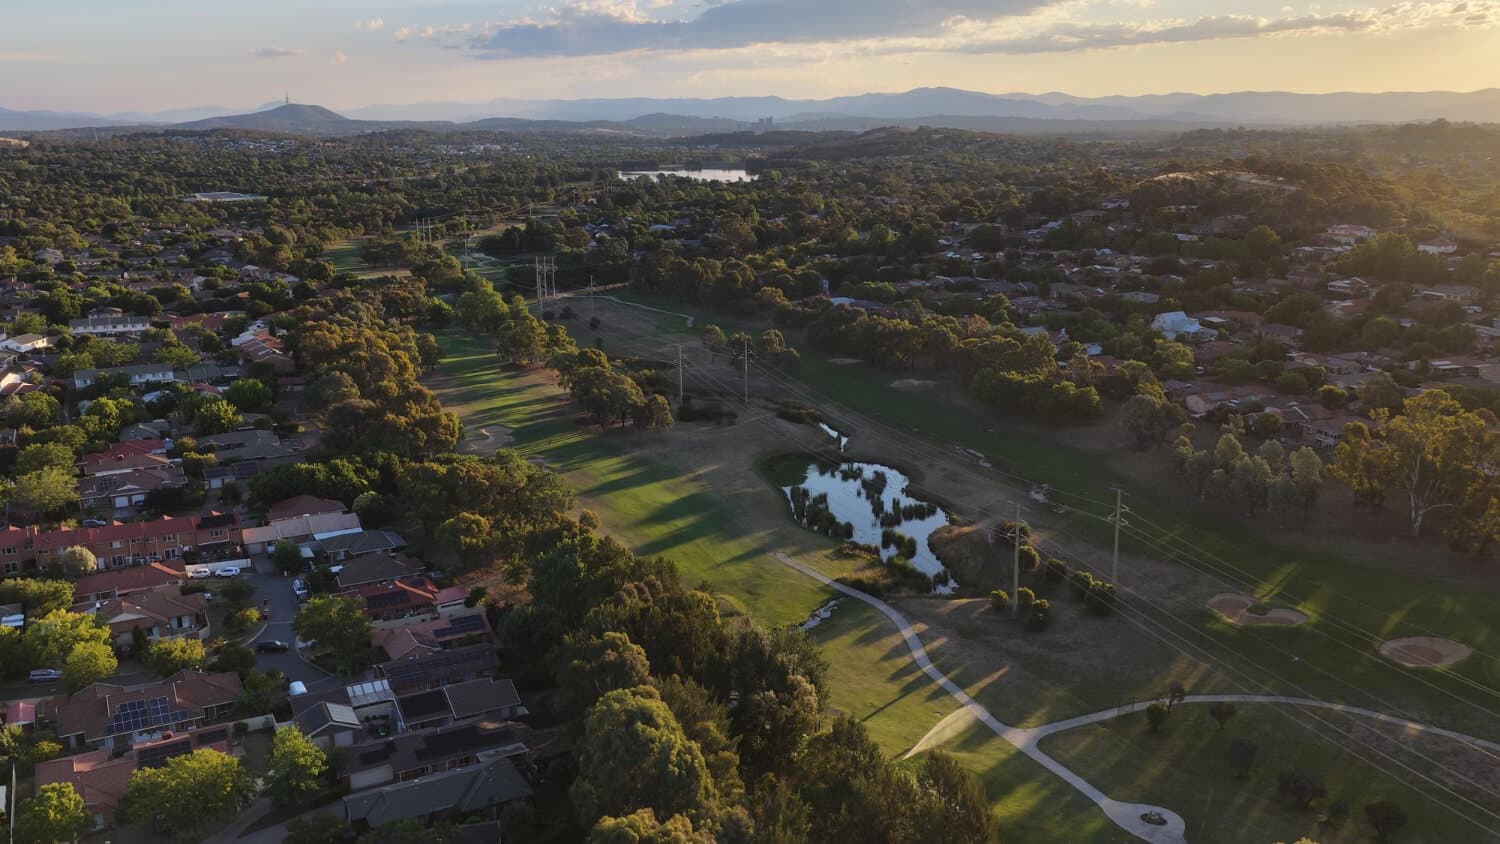
Want to find neighbourhoods where property values rise faster? High-growth suburbs—areas with new schools, transport upgrades, or booming job markets—offer the best investment returns. Spotting these hotspots isn’t about luck; it’s about checking for rising auction rates, shrinking vacancy periods, and planned infrastructure like hospitals or shopping centers. This guide breaks down how to track price trends, compare local demand, and avoid overhyped areas. Learn to invest where growth is just starting, not where it’s already peaked.
Why High-Growth Suburbs Matter for Investors
Targeting high-growth suburbs maximises returns while minimising risk. These areas combine rising property values, reliable tenant demand, and resilience against market shifts. Here’s why they’re essential for strategic investors:
Capital Appreciation
High-growth suburbs experience faster value increases due to infrastructure projects like new schools, hospitals, or transport links. For instance, suburbs with approved metro expansions often see prices rise 5–7% annually as accessibility improves. Population growth from job opportunities or lifestyle appeal further drives demand, ensuring that properties appreciate steadily. This equity growth lets investors refinance for future purchases or renovate to boost returns.
Steady Rental Income
Tenants flock to suburbs with amenities like parks, shopping centers, and short commutes. Areas near universities or business hubs maintain low vacancy rates (under 2%), delivering consistent yields of 4–6%. Investors benefit from reliable cash flow, especially in family-friendly neighbourhoods with growing schools or upgraded public services. Avoid oversupplied markets by checking local rental demand trends.
Long-Term Market Stability
Diverse economies—mixing retail, healthcare, and tech jobs—shield suburbs from downturns. Gentrification in undervalued areas, marked by new cafes or renovated homes, signals lasting growth. Infrastructure investments (like highways or hospitals) also stabilise prices by attracting long-term residents. These factors reduce volatility, making high-growth suburbs safer bets over decades.
By prioritising data-driven growth indicators, investors secure assets that appreciate and generate income, building wealth sustainably.
Key Indicators of High-Growth Suburbs
Identifying suburbs poised for growth requires analysing data-driven trends. These factors separate short-term hype from sustainable appreciation:
1. Infrastructure Development
Planned or ongoing projects like Brisbane’s $5.4 billion Cross River Rail (opening 2025) boost accessibility and demand. Suburbs near new stations—Woolloongabba, Albert Street, or Exhibition—attract buyers seeking shorter commutes. Upgrades to roads (Gateway Motorway) or amenities (Logan Hospital) also signal growth. For example, Kedron and Stafford saw price jumps after airport link tunnels improved connectivity.
2. Population Growth Trends
Suburbs with annual population increases above 2% (like Ipswich or Logan City) indicate rising housing demand. ABS data shows that young families and professionals drive growth in areas near universities or job hubs. Low vacancy rates (<2%) in suburbs like South Brisbane confirm tenant demand, supporting rental yields.
3. Employment Opportunities
Proximity to expanding job hubs—Brisbane’s CBD, RAAF Base Amberley, or Crestmead Logistics Park—boosts buyer interest. Suburbs like Fortitude Valley and Woolloongabba thrive due to nearby tech and healthcare sectors. Planned business parks in growth corridors (e.g., Northshore precinct) also attract workers, lifting property values35.
4. Rental Yield and Vacancy Rates
Target suburbs with rental yields exceeding 4% (common in Ipswich and Redcliffe) and vacancies under 2%. CoreLogic data shows areas like Kedron achieved 28% annual growth, partly due to high tenant demand. Avoid oversupplied markets by checking realestate.com.au for listings versus rental inquiries36.
5. Property Price Trends
Consistent 5–10% annual price growth (e.g., Chapel Hill’s 30% surge) signals stability. Use Domain’s historical data to avoid “peaked” suburbs. Focus on areas like Zillmere or Geebung, where median prices rose steadily alongside infrastructure upgrades, not speculation.
6. Lifestyle Amenities
Suburbs with parks, cafes, and top schools (Indooroopilly, Ashgrove) attract long-term buyers. West End’s cultural scene and Redcliffe’s waterfront draw tenants willing to pay premium rents. Gentrification signs—new cafes in Wooloowin or renovated homes in Nundah—also indicate rising appeal.
7. Suburb Demographics
ABS Census data reveals growth potential: suburbs with growing under-40 populations (South Brisbane, Teneriffe) often see higher demand. Balanced income levels and family-friendly amenities (e.g., Camp Hill’s schools) reduce turnover, stabilising prices. Avoid areas with aging populations or declining incomes.
By prioritising these indicators, investors target suburbs where growth is sustainable, not speculative.
Common Mistakes to Avoid When Identifying High-Growth Suburbs
Avoiding these errors ensures your investment targets suburbs with sustainable growth, not short-lived spikes:
Overvaluing Price Trends Alone
Price jumps (like Brisbane’s 2023 11% median rise) can mask risks. Suburbs like Logan saw temporary spikes from interstate buyers, only to plateau when infrastructure lagged. Always cross-check growth with planned projects (e.g., Cross River Rail stations) and ABS population data. A 20% annual price surge means little if schools or hospitals aren’t expanding to support new residents.
Chasing Hype Over Data
Media buzz around “next big suburbs” often overlooks oversupply risks. For example, inner-city Brisbane apartments faced price drops post-2022 due to excess stock. Instead, target adjacent suburbs like Zillmere, where gentrification (renovated homes, new cafes) aligns with infrastructure upgrades. Verify claims with CoreLogic sales history and council development plans.
Ignoring Rental Market Health
Low vacancy rates (<2%) and yields above 4% (common in Ipswich or Redcliffe) signal tenant demand. Avoid suburbs like Springfield Lakes, where vacancy rates spiked to 5% in 2024 due to oversupply. Use SQM Research data to spot areas where rental inquiries outpace listings—a sign of lasting demand.
Underestimating Lifestyle Appeal
Buyers pay premiums for suburbs with parks, schools, and transportation. West End’s cultural hubs or Redcliffe’s waterfront drove 18% annual growth, while purely industrial areas stagnated. Check for “gentrification markers”: new coffee shops in Wooloowin or upgraded playgrounds in Nundah.
By prioritising verified data over speculation, investors avoid costly missteps and target suburbs where growth is built to last.
Tools and Resources for Suburb Research
Accurate data separates guesswork from strategy. These platforms provide insights for pinpointing high-growth suburbs:
- CoreLogic (PropertyValue & RP Data): Track capital growth and rental yields with CoreLogic’s suburb investment scores (updated monthly). Their RP Data platform maps historical sales, zoning changes, and owner history. Investors compare suburbs using metrics like median price growth (e.g., 12% annual in Zillmere) or rental demand trends. Features like “Watch Lists” alert you to new listings in target areas, while valuation models estimate a property’s fair market value.
- SQM Research: Avoid high-vacancy suburbs (>3%) with SQM’s rental market dashboard. Their vacancy rate reports (updated weekly) highlight areas like Ipswich (1.2% vacancies) versus oversupplied Gold Coast units (5.4%). Custom alerts notify investors of sudden rent increases or yield drops, helping balance cash flow and growth goals.
- ABS Census Data: ABS tools reveal population shifts, income levels, and employment types by suburb. For example, 2026 Census previews show Underwood’s under-40 population grew 18% (driving housing demand). Use “Suburb and Locality” profiles to check school enrollments or family sizes—key indicators of long-term stability.
- Domain & Realestate.com.au: Compare median prices, auction clearance rates, and “days on market” trends. Domain’s realEstimate™ calculates property values using recent sales, while Realestate.com.au’s “Demand Score” ranks suburbs by buyer inquiries. Filter listings by amenities (e.g., “near hospitals”) to align with tenant priorities.
These tools turn raw data into actionable strategies—whether targeting Brisbane’s Cross River Rail suburbs or coastal rental hotspots.
The Infrastructure Timeline and Price Movement
Understanding the mechanics of timing is essential for executing a successful property acquisition.
Stage 1 – Announcement Phase
The timeline begins when the government officially proposes a new project. Media coverage surges, and market awareness increases rapidly. During this phase, speculative activity begins as investors attempt to secure property in the anticipated growth corridor.
Risk of Buying Too Early
Entering the market at the announcement phase carries inherent dangers. Projects are often subject to political shifts, budget blowouts, or environmental roadblocks. If a proposed rail line is cancelled or delayed by a decade, investors who purchased based solely on that announcement may face stagnant capital growth.
Stage 2 – Construction Phase
Risk decreases significantly once funding is locked in and earthworks commence. Improved confidence ripples through the market. As physical progress becomes visible, population movement begins to shift toward the area in anticipation of the completed project.
Employment Surge During Construction
The immediate area experiences an influx of engineers, project managers, and construction personnel. This temporary workforce requires housing, injecting immediate capital into the local economy and supporting local businesses.
Rental Demand Acceleration
Because these workers need accommodation close to the site, rental demand accelerates sharply. Landlords often see a drop in vacancy rates and an increase in weekly rental yields during this heavy construction period.
Stage 3 – Completion Phase
When the project finally opens to the public, the promised accessibility is fully realised. Commuters experience the upgraded transport links, and the suburb’s enhanced status becomes common knowledge. At this point, capital growth often peaks as the broader market recognises the area’s new value.
Diminishing First-Mover Advantage
By the time the ribbon is cut, the opportunity for rapid equity generation has usually passed. The wider market has already priced the infrastructure benefits into local property values, leading to a diminishing first-mover advantage for late arrivals.
The Common Stages of Gentrification in Australian Cities
Gentrification moves through distinct, measurable phases. Recognising which stage a suburb is currently in dictates the strategic viability of the acquisition.
Early Infrastructure and Investment Activity
Transformation begins with public capital. Transport, retail, and public infrastructure improvements signal the initial phase of renewal. Local councils and state governments commit funds to upgrade roads, rail links, or hospital precincts. This early stage often goes unnoticed by the general public, but it provides the critical foundation for future private investment.
Changing Demographics and Rental Demand
As infrastructure improves, population movement follows. You see evolving tenant demand patterns as young professionals and higher-income earners move into the area, attracted by new amenities and relative affordability. The socio-economic baseline of the suburb begins to rise. Retail environments pivot to service this new demographic, replacing older discount stores with higher-end commercial tenancies.
Increased Development and Urban Renewal
Private capital accelerates the transformation. Developers secure sites to build townhouses and apartments, while existing owners undertake major renovations. Upgraded housing stock and commercial investment activity change the physical streetscape. At this stage, the area sheds its previous stigma, and mainstream buyer interest begins to register on market data platforms.
Rising Demand and Reduced Supply
The suburb becomes an established target. Increased investor and tenant competition in transformed markets drives up acquisition costs and rental prices. The volume of available investment-grade stock drops rapidly. Amateur investors typically enter the market at this stage, paying a premium because the gentrification is now obvious.
Mature Growth Markets
The cycle concludes when the suburb transitions into a premium location. Established infrastructure and stronger market recognition mean the area commands top-tier pricing. While rental demand remains secure, the rapid capital growth phase stabilises. Sophisticated investors often leverage the equity manufactured here to target new acquisitions in suburbs currently entering the early stages of the cycle.
Performance-Based Definition vs Marketing Definition
The real estate industry thrives on enthusiasm. Agent marketing language is designed to sell properties quickly and for the highest possible price, often masking structural flaws with emotive adjectives. They will sell you a high-density, off-the-plan apartment using the promise of strong depreciation schedules and rental guarantees.
A performance-based definition strips away this marketing language. Data-driven performance standards require historical evidence of growth, restricted supply pipelines, and verifiable economic drivers. The difference between the two definitions is the difference between hoping a property increases in value and mathematically projecting that it will. Reinforcing disciplined evaluation protects your capital from slick sales campaigns.
Long-Term Capital Growth as the Core Benchmark
The primary metric of any investment-grade property is consistent long-term capital appreciation. While cash flow keeps you in the game, capital growth is what actually creates wealth. A true blue-chip asset should demonstrate the capacity to double in value every seven to twelve years.
This sustained growth is the engine of portfolio compounding. When a property appreciates reliably, it generates the equity necessary to fund subsequent acquisitions. Without this core benchmark, a portfolio stagnates, leaving the investor trapped with an underperforming asset that absorbs borrowing capacity without providing financial momentum.
Data Points Smart Investors Review Before Buying
Beyond the macro framework, securing the best suburbs for investment in Australia 2026 requires a deep analysis of micro-market performance metrics. These specific suburb growth indicators in Australia highlight the immediate health of the local property market.
10-Year Median Growth Trend
Short-term price spikes can be misleading, often driven by temporary stimulus or localised hype. Analysing the 10-year median growth trend provides a clear picture of a suburb’s historical resilience and fundamental strength. Consistent, steady compounding growth is highly preferable to erratic, volatile price swings.
Days on Market
This metric tracks the average number of days a property sits listed before it sells. A declining ‘days on market’ figure indicates that buyer demand is increasing and available stock is being absorbed rapidly. When properties transact in less than 30 days, the market is highly competitive, often signalling impending capital growth.
Clearance Rates
In states where auction campaigns are prevalent, clearance rates provide a real-time snapshot of buyer sentiment. A clearance rate consistently holding above 70% suggests strong market confidence and competitive bidding. While not applicable to every state or off-market transaction, it remains a valuable gauge of broader demand within a specific postcode.
Absorption Rates
The absorption rate measures how quickly available housing inventory is sold within a specific timeframe. It is calculated by dividing the number of sales in a given month by the total number of available properties. A high absorption rate indicates an aggressive seller’s market, where buyers far outnumber the available properties, placing upward pressure on values.
Net Interstate Migration Patterns
The movement of residents between states is actively reshaping the national property landscape. Recent data highlights distinct net interstate migration patterns, with significant populations moving away from higher-density, higher-cost capitals toward affordability corridors.
States like Queensland and Western Australia have seen massive inflows, with net interstate migration adding tens of thousands of new residents to their respective populations. South Australia, particularly Adelaide’s northern sectors, is also capturing a growing share of this internal movement. For investors, this migration signals a clear shift in where long-term housing demand is settling.
How House Finder Can Help
House Finder simplifies Brisbane property investment by combining data, local expertise, and tailored strategies. Here’s how we deliver results:
- Data-Driven Suburb Analysis: We analyse CoreLogic sales trends, ABS population shifts, and infrastructure projects (like Cross River Rail stations) to pinpoint suburbs with sustainable growth—not just hype. For example, we’ve identified Zillmere and Geebung as undervalued areas where median prices rose 12–15% annually post-transport upgrades.
- Custom Market Reports: Receive detailed reports on high-growth suburbs like Logan (rental yields over 5%) or Redcliffe (price surges from waterfront gentrification). Our forecasts highlight upcoming schools, job hubs, and zoning changes, so you invest where demand will rise, not where it already has.
- Strategic Property Sourcing: We target off-market listings and negotiate purchases 5–10% below market value. Recently, we secured a four-bedroom Ferny Grove home for $820,000—$65k under the asking price—by leveraging seller urgency and pre-auction offers.
- Stress-Free Compliance Checks: Our team handles building inspections, contract reviews, and council regulation checks. Clients avoid costly oversights like unapproved renovations in Mitchelton or rising strata fees in Bowen Hills units.
It’s Time to Invest Smarter
Ready to target suburbs like Logan or Zillmere—where infrastructure upgrades and population growth drive real value? House Finder analyses live market data, Cross River Rail updates, and rental trends to pinpoint high-growth areas before they peak.
We negotiate off-market deals, flag hidden risks, and ensure your purchase aligns with 5–10% annual returns. Skip the guesswork; our team hands you Brisbane’s next hotspots, backed by proven strategies. Contact House Finder today—transform research into results.
Related: Buyers Agent Services: Expert Property Support Without the Stress